The Most Traded Currency Pairs (and Why Liquidity Matters)
The most traded currency pairs ranked from BIS survey data, why the dollar is in nearly all of them, and how liquidity cuts your spreads and slippage.

Your platform lists dozens of currency pairs, yet most of the world’s currency trading happens in only a handful of them. Knowing which are the most traded currency pairs, and why busy markets are cheaper and smoother to trade, is one of the simplest ways to keep your costs down.
Quick answer: The most traded currency pairs are EUR/USD, USD/JPY and GBP/USD, in that order in recent Bank for International Settlements surveys, with EUR/USD alone making up around a fifth or more of global turnover. Heavy trading means deep liquidity: tighter spreads, less slippage and steadier charts, especially when London and New York are both open.
What are the most traded currency pairs?
The most reliable count of currency trading comes from the Bank for International Settlements (BIS), the Basel-based organisation owned by the world’s central banks. Every three years, in April, central banks and other authorities in dozens of countries collect turnover figures from the banks and dealers they supervise, and the BIS combines them into its Triennial Central Bank Survey. The latest edition found that currency trading averaged about $9.6 trillion a day in April 2025, up from $7.5 trillion in 2022 (BIS Triennial Survey).
Not all of that is the kind of trading you see on a chart. The largest single slice is FX swaps, which banks and companies use to borrow and lend currencies for short periods. Spot trading, the instant exchange that retail prices are based on, is a smaller share. That explains why the headline number is so large, but it hardly changes which pairs come out on top.
The ranking by pair has been remarkably stable for decades. The chart shows the top seven in the 2022 survey, rounded; the 2025 survey kept the same top three.
EUR/USD has topped every survey since the euro was launched, and in recent editions it has made up between a fifth and a quarter of all turnover. It joins the two largest currency areas in the world, and the euro is the second most traded currency after the dollar. A huge flow of trade, investment and bond buying runs between the eurozone and the United States every day. Our EUR/USD trading guide covers what moves it.
USD/JPY is usually a clear second. Japan is a large economy whose investors hold vast amounts of foreign assets, and the yen has long been both a funding currency for investors borrowing cheaply and a safe haven when markets take fright. Both roles generate a great deal of trading. The USD/JPY trading guide explains how they pull against each other.
GBP/USD, known as cable, is usually third. The pound is a smaller currency than the euro or yen, but London is the biggest currency trading centre in the world, and sterling is traded heavily there. See the GBP/USD trading guide for its drivers.
Below the top three, the order shifts from survey to survey. The dollar against the Chinese yuan has climbed into the top handful, but it is a managed currency: China’s central bank keeps the onshore rate within a band around a daily reference rate, and much of that volume is hedging that retail platforms rarely offer. The remaining majors, USD/CAD, AUD/USD and USD/CHF, each account for roughly 4 to 6%. Even the busiest crosses, such as EUR/GBP and EUR/JPY, are a small fraction of EUR/USD’s volume. Our guide to major, minor and exotic currency pairs explains how those groups are defined.
Why the US dollar is on almost nine in ten trades
The US dollar was on one side of about 89% of all currency trades in 2025. The euro, the next most traded currency, appears in less than a third.
Those two figures add up to more than 100% because of how the BIS counts. Every trade involves two currencies, so each trade is counted once for each of them, and currency shares add up to 200%. The diagram shows the arithmetic on ten imaginary trades.
Why is the dollar everywhere? It is the world’s main reserve currency. Oil and many other commodities are priced in it, a large share of international trade and borrowing is invoiced in it, and central banks hold more of it than any other currency. Companies and investors need dollars constantly, so dollar markets are the deepest of all.
That depth creates a second reason. The dollar acts as a vehicle currency: a stepping stone between two currencies that rarely trade directly. Imagine a Swedish company that has to pay a supplier in Mexican pesos. There is hardly any direct market between the Swedish krona and the peso, so its bank usually sells krona for dollars and then dollars for pesos.
Two trades through deep markets usually cost less than one trade through a shallow one. Repeat that across thousands of banks and millions of payments and the dollar ends up on almost every trade, which in turn keeps its markets the deepest.
This has a practical consequence. Because all of the most traded pairs share the dollar, they tend to move together whenever the dollar itself moves. Buying EUR/USD, GBP/USD and AUD/USD at the same time is largely one bet against the dollar. The same goes for news: a US jobs report or inflation figure moves every major pair at once, which is why traders of the busiest pairs watch the US calendar first (see how to read an economic calendar). Our guide to currency correlation and the lesson on correlation risk show how to count that overlapping exposure.
What liquidity means, and where it comes from
Liquidity is how easily you can buy or sell a meaningful amount without moving the price much. It has three parts worth knowing:
- Tightness: how close the buying and selling prices are. That is the spread.
- Depth: how much can be traded at or near the quoted price before it starts to move.
- Resilience: how quickly fresh orders arrive to refill the market after a large trade.
A heavily traded pair scores well on all three. A thin pair, or a busy pair at a quiet hour, scores poorly on at least one.
As a retail trader you never see where this liquidity lives. Your broker streams prices that come from liquidity providers: large banks and specialist trading firms that quote buying and selling prices continuously and stand ready to trade at them. The broker either passes your order on to them or fills it itself and manages the risk. Tap between the two models below.
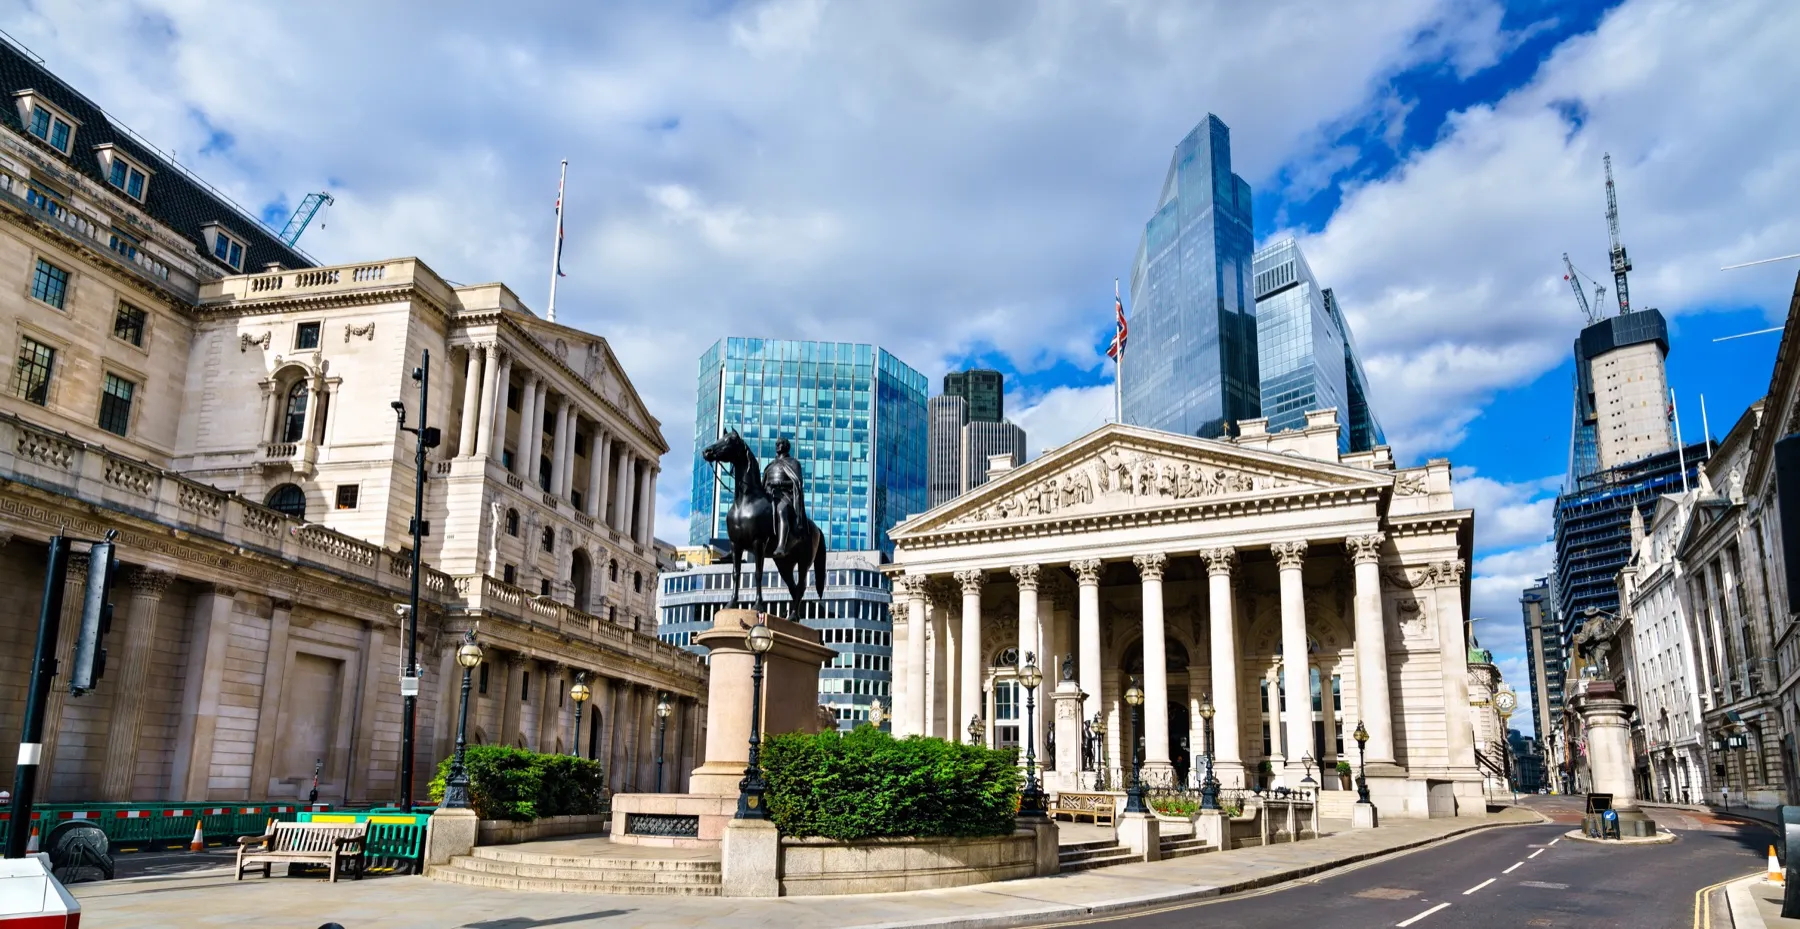
Where your price comes from. Liquidity providers, mostly large banks and specialist trading firms, quote the pairs continuously. The more of them quoting a pair, the tighter and deeper the price your broker can offer.
Liquidity providers compete hardest in the pairs where the most business is done. In EUR/USD at mid-afternoon London time, dozens of them are quoting at once and each wants the flow, so the best prices are squeezed very close together. In a lightly traded pair, or at 3 a.m., fewer providers are active, each is taking more risk per trade, and they protect themselves by quoting wider prices and smaller sizes.
The result is a loop that keeps the rankings stable. Busy pairs are cheap to trade, so more traders choose them, which makes them busier still. The diagram shows what that depth changes for you.
Why liquidity matters for your trading
Liquidity can sound like a concern for banks moving billions. It matters just as much at retail size, in four specific ways.
Tighter spreads
You pay the spread every time you open a trade. On the most traded pairs in their busy hours it is usually a fraction of a pip to around a pip at many brokers, while on thin pairs it can be several times that. Because the cost repeats on every trade, the difference compounds over a year far more than most beginners expect. Our guide to the bid-ask spread and the lesson on the spread show how it is set and how to read it.
Less slippage
Slippage is the gap between the price you asked for and the price you got. A market order or a triggered stop loss fills at the next available price, and in a deep market the next price is almost always very close. In a thin or fast market, the nearest orders can be several pips away. Try both conditions in the simulator.
Illustrative. In calm, liquid conditions a market or stop order fills at or near the price you see. When liquidity drains, the next available price can be several pips away. Limit orders avoid slippage but may not fill.
Slippage on a liquid pair is normally small and goes both ways. When it is consistently large or only ever against you, the cause is usually the hour, the news or the broker, not bad luck. The lesson on execution and slippage shows how to test a broker’s fills, and our full guide to slippage in forex covers ways to limit it.
Smoother charts and more reliable levels
In a deep market, a single large order is absorbed by many others, so prices move in orderly steps. Support and resistance levels reflect the decisions of thousands of participants. In a thin market, one large order can punch straight through several price levels before anyone steps in, leaving a long wick that says more about the hour than about the market’s opinion. Step through the example.
Illustrative EUR/USD prices. In liquid hours the support level is respected cleanly. In a thin hour, one large sell order spikes through support and the stop, then price recovers. The level held; the trade did not.
A stop placed just beyond a level needs the market to be deep enough to respect that level. In thin hours, either give the trade more room and a smaller size, or avoid holding a tight stop through them.
Easier exits when you are wrong
The last benefit matters most when things go badly. In a liquid pair you can almost always close a position at a price close to the one on screen, even in a large size and even on a busy news day. In a thin pair, the moment you most want to get out, after a shock, is exactly when liquidity providers pull back and spreads blow out. Getting out cheaply is a form of risk control in its own right.
Liquidity by session: when the most traded pairs are deepest
The forex market is open around the clock on weekdays, but liquidity is not spread evenly across those hours. It follows where the trading desks are, and the BIS survey shows they are heavily concentrated.

That concentration sets the daily rhythm of liquidity. The clock below shows the four main sessions in your own time zone.
Open now: …
The four main forex sessions in your local time. Liquidity in the most traded pairs is deepest while London is open, and deepest of all in the London–New York overlap marked on the outer ring.
In practice the day breaks down like this:
- London open to the overlap. Liquidity jumps when London opens and stays high through the morning. EUR/USD, GBP/USD and the euro and pound crosses are at their tightest here.
- The London–New York overlap. Roughly midday to 4 p.m. UTC in the northern summer (an hour later in winter), with both of the largest centres open, is usually the deepest window of the day for almost every major pair. The 4 p.m. London benchmark rate, the “fix”, when many funds rebalance, often brings a burst of volume late in the overlap.
- Asian hours. Tokyo, Singapore and Hong Kong keep USD/JPY, AUD/USD and NZD/USD reasonably liquid, but EUR/USD and GBP/USD are noticeably thinner than in London hours.
- After New York closes. Around 5 p.m. New York time the daily rollover arrives, many liquidity providers step back, and spreads on even the most traded pairs can widen to several times their daytime level for a while.
Our guide to forex market hours covers the session times and daylight-saving shifts in detail. A pair is only as liquid as the hour you trade it in. EUR/USD at 3 p.m. in London and EUR/USD late on a Friday evening are, for practical purposes, two different markets.
Liquidity can also vanish at predictable moments regardless of the clock: in the seconds around major data releases, on public holidays in the big centres, in the last days of December and before weekends. Occasionally it vanishes unpredictably. In October 2016 the pound fell roughly 6% in a matter of minutes during thin Asian trading before recovering much of the drop, and in early January 2019, during a Japanese holiday, the yen jumped several percent within minutes against the dollar and the Australian dollar. Both pairs were among the most traded in the world, but neither was liquid at that hour.
Liquid is not the same as calm
The most liquid pair is not necessarily the safest or the slowest. Liquidity and volatility are separate properties. Liquidity is about how easily you can trade; volatility is about how far the price travels. A pair can be deep and still move a long way in a day, and a thinly traded pair can sit almost still for months.
GBP/USD is among the most traded pairs in the world, yet it often travels further in a day than EUR/USD. USD/JPY is deep, yet it can move sharply around Bank of Japan decisions or official intervention. Meanwhile a pegged currency such as the Danish krone barely moves against the euro, but a peg can feel completely calm right up to the day it breaks.
So use liquidity and volatility for different decisions. Liquidity tells you what a trade will cost and how reliably you can get in and out. Volatility tells you how wide your stop needs to be, and therefore how small your position must be for the same risk. The lesson on position sizing shows the arithmetic for any stop distance.
For most people learning to trade, the bottom-right box is the sensible place to begin: one or two of the most traded pairs, in the hours when they are deepest. That is not a prediction that they will be profitable. It removes avoidable costs while you find out whether your method works. Our guide to the best currency pairs for beginners goes through that choice, and the one on exotic currency pairs covers the other end of the scale.
The example below shows what the same trade costs when liquidity is there and when it is not.
Common mistakes with the most traded currency pairs
Assuming a liquid pair is always liquid
EUR/USD is the deepest market in the world for most of the day and a surprisingly thin one at others. Check the spread at the exact hours you trade, not the “from” figure on a broker’s website, and avoid holding tight stops through the rollover and the moments around big data releases.
Treating three dollar pairs as three separate trades
Because the dollar is in all of the most traded pairs, positions in several of them are often one bet on the dollar. Add up your exposure to each currency before you add another position.
Reading the BIS ranking as a recommendation
The survey measures where banks, funds and companies do their business, not which pairs suit you. USD/CNY ranks highly but is a managed rate that retail traders rarely access. Use the ranking to understand costs, not to choose a strategy.
Confusing liquidity with low risk
A deep pair is cheap to trade, not safe to trade. GBP/USD and USD/JPY can move a long way in a day, and with leverage a liquid pair can empty an account as quickly as a thin one. Size every trade from its stop distance.
Chasing activity instead of fitting your hours
Trading only in the overlap is pointless if it falls in the middle of your working day and you trade rushed. Pick the most liquid pairs for the hours you can actually be present, such as USD/JPY or AUD/USD in Asian hours, rather than forcing a pair into a time when it is thin.
Frequently asked questions
What is the most traded currency pair in the world?
EUR/USD, the euro against the US dollar. It has been the most traded pair in every Bank for International Settlements survey since the euro was launched, and in recent surveys it has made up between a fifth and a quarter of all global currency turnover. That volume is why it usually has some of the tightest spreads available to retail traders.
What are the top 3 most traded currency pairs?
In recent BIS surveys the top three have been EUR/USD, USD/JPY and GBP/USD, in that order. Together they account for more than 40% of all global currency turnover. All three contain the US dollar, so they often react to the same US news and can move together.
Why is the US dollar in most forex trades?
The dollar is the main reserve currency and is used to price commodities, invoice trade and lend across borders. It also acts as a vehicle currency: banks often exchange two smaller currencies via the dollar because both dollar markets are deeper than the direct one. The BIS found the dollar on one side of about 89% of trades in 2025.
Which currency pairs are the most liquid?
The most liquid pairs are the most traded ones: EUR/USD, USD/JPY and GBP/USD, followed by the other dollar majors such as USD/CAD, AUD/USD and USD/CHF. Liquidity also depends on the hour, so even these pairs are thinner after the New York close and on major holidays.
When is the forex market most liquid?
Usually during the London–New York overlap, roughly midday to 4 p.m. UTC in summer and an hour later in winter, when the two largest trading centres are open together. The London morning is also very liquid. The quietest period is the hour or two after New York closes, when spreads on most pairs widen.
Free course
Learn this step by step
“Forex Foundations” is a free BrokerCut Academy course: 11 short lessons (about 92 minutes), quizzes, interactive tools and a certificate when you finish.
Enrol free