GBP/USD Trading Guide: Cable's Volatility and How to Handle It
GBP/USD trading explained: why cable swings further than EUR/USD, what moves it, when it is busiest and how to size trades for its wider ranges.

Cable often travels further in an hour than EUR/USD does all morning. That energy is what draws people to GBP/USD trading, and it is also what catches out anyone who sizes it like a calmer pair.
Quick answer: GBP/USD, nicknamed cable, is the price of one pound in US dollars. It usually swings further in a day than EUR/USD, moves on Bank of England and Federal Reserve policy and UK and US data, and is busiest from the London open to the New York overlap. Handle it with wider stops and smaller positions.
What is GBP/USD? Cable in plain English
GBP/USD is the exchange rate between the British pound sterling and the US dollar. The pound is the base currency, the thing being priced, and the dollar is the quote currency, the unit the price is written in. A quote of 1.2700 means one pound buys 1.27 dollars. When the number climbs, sterling is gaining on the dollar; when it drops, the dollar is gaining on sterling.
The pair’s nickname is cable, and it has a real history. In the mid-19th century a telegraph cable was laid across the floor of the Atlantic, and from then on the sterling–dollar rate was wired between London and New York along it. The quotes travel by fibre-optic link and satellite now, but the name stuck, and you will hear “cable is bid” or “cable’s dropping” on any trading floor.

Cable is one of the oldest and deepest markets in currency trading, and the Bank for International Settlements’ three-yearly survey of global turnover has long listed it among the most traded pairs in the world. That depth keeps prices continuous and spreads reasonable for most of the trading day.
The pair also compares two very different economies. The US is several times larger and issues the world’s reserve currency. The UK is a smaller, open economy that has run a current account deficit for many years, so it relies on steady inflows of foreign money, one reason sterling can react sharply when confidence wobbles. If the idea of base and quote currencies is still new, the Academy lesson on currency pairs and quotes walks through it step by step.
GBP/USD pip value and spreads
A pip on GBP/USD is the fourth decimal place, 0.0001. If cable moves from 1.2700 to 1.2745, it has moved 45 pips. Because the dollar is the quote currency, every pip is worth a fixed amount in dollars whatever the exchange rate happens to be:
| Lot size | Pounds traded | Value of one pip |
|---|---|---|
| Standard lot | 100,000 | $10 |
| Mini lot | 10,000 | $1 |
| Micro lot | 1,000 | $0.10 |
That is the same pip value as EUR/USD, but cable tends to cover more pips in a day, so a one-lot position on GBP/USD usually swings by more dollars over the same hours. If your account is in pounds, your broker converts the dollar result back into sterling, but the arithmetic is unchanged.
The counter below lets you type two GBP/USD prices and see the move in pips and its value at each lot size. Try a move of 100 pips, which is not unusual on a busy day for cable, and look at the standard-lot figure.
The highlighted digit is the pip. For USD/JPY the pip is the second decimal and its dollar value depends on the price.
Our guide to what a pip is in forex covers the arithmetic for every type of pair, and the lesson on pips and lots explains why lot sizes come in those three steps.
Cable’s spread
The spread is the gap between the bid and ask, and it is a cost you pay on every trade. GBP/USD is a major pair with deep liquidity, so its spread is normally tight, though usually a little wider than EUR/USD’s because fewer participants are quoting it. Like every pair, it widens at predictable moments: in quiet Asian hours, around the daily rollover late in the US evening, and in the seconds either side of a big UK or US release. On a fast pair, a stop placed too close can be triggered by the spread alone. Our guide to forex trading costs shows how spread, commission and swap add up over a year of trading.
GBP/USD volatility: why cable moves more than EUR/USD
Volatility means how far and how fast a price moves. GBP/USD volatility is usually higher than EUR/USD’s, and its average daily range, the distance from the day’s high to its low, has tended to be wider. Ranges expand and contract with the news cycle, so no single number is worth memorising, but the relationship between the two pairs has been fairly stable.
A thinner market than EUR/USD. Cable is deep, but not as deep as the euro–dollar pair, so a given amount of buying or selling pushes the rate further before it meets the other side.
Two sets of headline risk. EUR/USD reacts to US news and to news from a currency union of many countries, where individual national surprises tend to average out. GBP/USD reacts to US news and to news from one country with one central bank, one government and one statistics office. A single UK inflation surprise lands on the pound with full force.
Sensitivity to confidence. Because the UK depends on foreign capital to fund its current account deficit, sterling can behave like a risk-on currency: it tends to do well when investors are calm and suffer when they are frightened. That adds a second engine of movement on top of the domestic data.
None of this makes cable better or worse than EUR/USD. A strategy that works with a 20-pip stop on the euro may need 35 or 40 pips on the pound to give the same idea room to breathe, and that has direct consequences for how big your position can be. Our EUR/USD trading guide is a useful side-by-side read if you trade both.
When to trade GBP/USD: London open, UK data and the overlap
The forex market runs around the clock on weekdays, but GBP/USD keeps office hours. Its two home centres are London and New York, so it tends to be sleepy when both are closed and lively when either is open. The clock below shows the four main trading sessions in your own time zone, with the London–New York overlap on the outer ring.
Open now: …
The four forex sessions converted into your local time. GBP/USD is usually liveliest in the London session and the London–New York overlap, and quietest in the late US and Asian hours.
The most important moments of a cable trading day, in UK time, are shown on the timeline below.
Here is how those hours usually feel:
- Asian hours (roughly 23:00–07:00 UK time): cable tends to drift in a narrow band with wider spreads, and moves made here are often reversed once London arrives.
- 07:00 UK data: the Office for National Statistics publishes its market-moving releases, including inflation, monthly GDP and the labour market report, at 07:00 UK time. That is before London is fully staffed, so a surprise can produce a sharp, gappy move in a market that is still waking up.
- London open (from about 08:00): volume arrives. The overnight range is tested, the reaction to any early data is either confirmed or unwound, and the pair often picks a direction for the European morning.
- Midday on Bank of England days: decisions are published at 12:00 UK time, eight times a year.
- London–New York overlap (roughly 13:00–17:00): usually the busiest stretch. Most US data comes out at 13:30 UK time, and both of cable’s home markets are trading at once.
- Late US hours: activity fades after London closes, except on Federal Reserve decision days, when the announcement lands around 19:00 UK time.
If you can only trade for an hour or two a day, the London open and the overlap are where cable normally does most of its work. Our guide to forex market hours covers every session and the clock changes in detail, and the Academy lesson on market sessions shows how to match pairs to the hours you have.
What moves GBP/USD: the Bank of England versus the Fed
Over weeks and months, the deepest current under cable is the relationship between UK and US interest rates. Each central bank sets a policy interest rate, and money tends to flow towards the currency whose rates are higher, or expected to rise further. So what moves GBP/USD is the balance between two committees on either side of the Atlantic.
In the UK, policy is set by the Bank of England’s Monetary Policy Committee, which has nine members and a 2% inflation target. It meets eight times a year and publishes its decision, the minutes and each member’s vote at the same moment. A hold where several members unexpectedly voted for a cut can weaken the pound almost as much as a cut itself. Four times a year the Bank also publishes its Monetary Policy Report, with new forecasts for growth and inflation. In the US, the Federal Reserve pursues stable prices and maximum employment, also meets eight times a year, and follows its decision with a press conference.
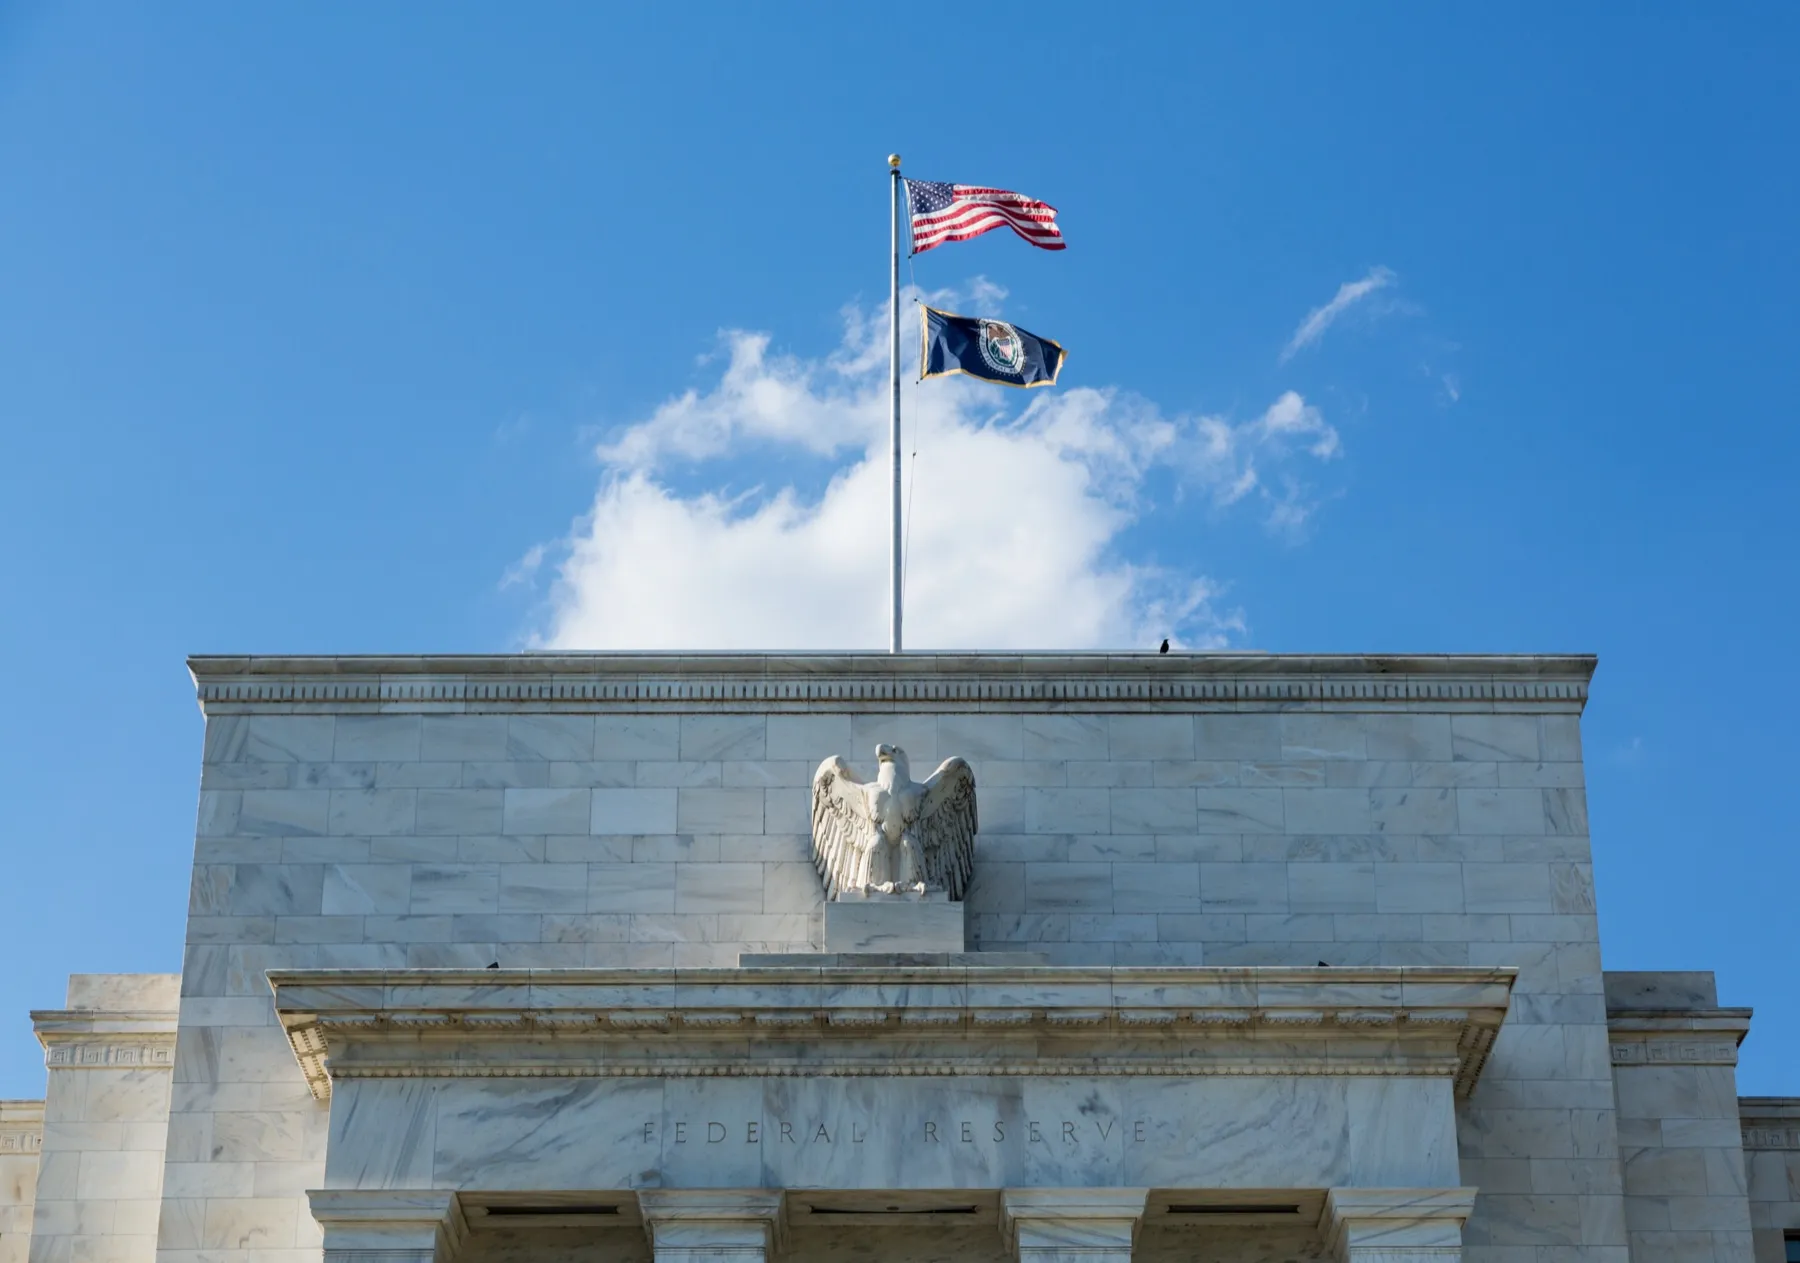
By the time either bank meets, the most likely outcome is usually priced in. Cable moves on surprises: a decision, a vote or a set of forecasts that is more hawkish or dovish than the market thought. The grid below shows how surprises from the two banks combine.
Two habits follow. On Bank of England days, read the vote split and the tone of the statement, not just the headline rate. And remember that a Fed decision can move cable as much as a UK one, because it reprices the dollar against every currency at once. Our guide on how interest rates affect currency prices explains the full chain from a rate decision to an exchange rate, and the lesson on central banks and interest rates covers how policy statements are read.
Other GBP/USD drivers: UK data, US data and politics
Most scheduled releases move cable because they change what traders expect the Bank of England or the Fed to do next.
UK inflation
The UK consumer prices index, or CPI, is published by the Office for National Statistics at 07:00 UK time, usually around the middle of the month. Because the Bank of England targets CPI inflation, this is often the single most market-moving UK release. Traders look beyond the headline figure to core inflation and services inflation, which the Bank watches closely as a guide to domestic price pressure.
UK jobs and wages
The ONS labour market report covers unemployment, employment and average earnings, which matter most for cable. Fast wage growth can keep inflation sticky, so a hot wage figure tends to push expectations towards higher UK rates and support the pound. The Academy lesson on jobs data and NFP explains how employment releases are read on both sides of the Atlantic.
UK GDP and business surveys
The ONS publishes a monthly estimate of GDP alongside the quarterly figures, and business surveys known as PMIs give an earlier read, usually at 09:30 UK time. They tend to move cable less than inflation and wages, unless they confirm a turn in the economy.
US data
Because the dollar is half of the pair, the US calendar matters as much as the UK one. The monthly jobs report and US CPI, both normally at 13:30 UK time, can move GBP/USD further in minutes than a quiet UK week does in days. Try the mock calendar below: tap a row, then move the actual figure away from the forecast. The US rows show the reaction on EUR/USD, but a dollar surprise usually pushes GBP/USD the same way; the PMI row shows cable directly.
| Time | Cur. | Impact | Event | Previous | Forecast | Actual |
|---|---|---|---|---|---|---|
| 13:30 | USD | ●●● | 3.2% | 3.1% | — | |
| 13:30 | USD | ●●● | 185k | 170k | — | |
| 19:00 | USD | ●●● | 4.5% | 4.5% | — | |
| 13:30 | USD | ●●● | 2.1% | 2.4% | — | |
| 13:30 | USD | ●●● | 3.9% | 3.9% | — | |
| 09:30 | GBP | ●●● | 50.2 | 50.5 | — |
A mock economic calendar for a busy day. Tap a row, then move the actual figure: the reaction comes from the gap between actual and forecast. US surprises move GBP/USD much as they move EUR/USD. Reactions are illustrative.
The lesson on the economic calendar explains impact ratings and how to filter for the pound and the dollar, and our guide to CPI and inflation data goes deeper on the most important release of the month.
Risk mood
When markets turn fearful, the dollar is a classic safe haven and sterling is not, so cable tends to fall on days when stock markets sell off hard, even with no UK news at all. Our guide to risk-on and risk-off explains why.
Politics and fiscal policy
Cable has a long memory for political shocks, and they are a large part of its reputation for volatility. On the night of the EU referendum in June 2016, the pound fell steeply as results came in, and within hours GBP/USD had reached its lowest level in more than 30 years. In September 2022, a package of large unfunded tax cuts unsettled investors’ confidence in the UK’s public finances; the pound fell to a record low against the dollar in thin early-Asian trading the following Monday, and within days the Bank of England stepped into the government bond market to restore order.
You do not need to forecast politics to trade GBP/USD. You do need to know when elections, budgets and other fiscal statements are scheduled, and to treat them like high-impact data: smaller size, or no position at all.
GBP/USD trading: how to handle the volatility
Knowing that cable moves more is only useful if it changes what you do. Wider stops, smaller positions and respect for the spread do most of the work.
Wider stops, smaller size
A stop loss has to sit where your trade idea is proven wrong, beyond the normal noise of the market. On a pair that routinely swings further, that point is usually further away. If you copy the stop distances you use on EUR/USD, cable’s ordinary wiggles will knock you out of trades that were never actually wrong.
But a wider stop on the same position size means a bigger loss when it is hit. The fix is to let the stop decide the size, not the other way round. You fix the amount of money you are willing to lose, usually a small percentage of the account known as your risk per trade, and then work out the position size that loses exactly that amount if the stop is reached:
Lots = money at risk ÷ (stop in pips × $10)
The diagram below shows what happens to size as the stop widens while the money at risk stays the same.
Sized correctly, a 40-pip stop on cable and a 20-pip stop on the euro lose the same amount. Volatility shows up in the size of the position, not the size of the loss. Try your own numbers in the calculator below: enter your balance, your risk percentage and a typical cable stop, and leave the pip value at $10.
With a 40-pip stop on $5,000 at 1%, the exact answer is 0.125 lots. The calculator rounds down to 0.12, the nearest size you can actually trade, so the real risk ($48) sits just under your limit rather than over it. Our guide to position sizing in forex covers the method in full, and the lessons on position sizing and stop-loss placement show how to choose the stop itself.
Respect the spread and the release
Spreads on cable widen around 07:00 UK data, Bank of England decisions and US releases, and fills can arrive away from your price, which is called slippage. Many traders stay flat for a few minutes either side of a major release and trade the market that is left once spreads are back to normal.
Count your dollar exposure
GBP/USD tends to move with EUR/USD and against USD/CHF, because a large share of each day’s movement is really the dollar. Tap a cell in the grid below to see what each relationship means, and use the exposure counter to see how quickly separate trades become one bet.
Typical correlation between pairs
| EUR/USD | GBP/USD | AUD/USD | USD/JPY | USD/CHF | USD/CAD | |
|---|---|---|---|---|---|---|
| EUR/USD | ||||||
| GBP/USD | ||||||
| AUD/USD | ||||||
| USD/JPY | ||||||
| USD/CHF | ||||||
| USD/CAD |
Tap any cell to see what that correlation means for two open positions.
How many times are you really betting on the dollar?
Illustrative long-run correlations between GBP/USD and other major pairs, not live data. Cable usually moves closely with EUR/USD and in the opposite direction to USD/CHF, so trading them together can double a single dollar bet.
Buying cable and buying EUR/USD at the same time is close to doubling one position. The Academy lesson on correlations and our guide to currency correlation show how to keep that exposure in check.
Common mistakes when trading GBP/USD
Using EUR/USD stops on cable
The most common error is carrying stop distances over from a calmer pair. A 15-pip stop that suits the euro on a quiet day can sit inside cable’s normal noise. Measure recent ranges on GBP/USD itself and set stops from its structure, as our guide on where to place a stop loss explains.
Keeping the same lot size when the stop widens
The second most common error is the mirror image: widening the stop correctly, then trading the usual lot size anyway. That quietly turns a 1% risk into 2% or 3%. Recalculate the size every time.
Forgetting about 07:00
UK data arrives before many traders are at their desks. Holding a position into a CPI release without knowing it was due is a gamble, not a plan, so check the calendar the evening before.
Reading only the UK side
A brilliant UK wage figure can be erased an hour later by strong US jobs data. Every GBP/USD trade is a view on two economies, so check both calendars.
Treating political events as ordinary days
Elections, budgets and other fiscal statements can produce moves far outside cable’s normal range, often in thin markets. If one is scheduled, reduce size or step aside until the dust settles.
Frequently asked questions
Why is GBP/USD called cable?
The nickname dates from the mid-19th century, when a telegraph cable across the Atlantic seabed began carrying the sterling–dollar exchange rate between London and New York. Quotes now travel electronically, but traders kept the name.
How much is 1 pip worth on GBP/USD?
Because the US dollar is the quote currency, one pip on GBP/USD is worth $10 on a standard lot of 100,000 pounds, $1 on a mini lot and 10 cents on a micro lot. If your account is in pounds or euros, the broker converts that dollar amount at the current exchange rate.
What time is GBP/USD most active?
GBP/USD is usually most active from the London open at about 08:00 UK time through the London–New York overlap, roughly 13:00 to 17:00 UK time. UK data at 07:00, Bank of England decisions at 12:00 and US data at 13:30 add bursts of activity. Asian hours are usually quiet.
Is GBP/USD more volatile than EUR/USD?
Usually, yes. Cable has tended to have wider daily ranges than EUR/USD, because its market is less deep, it reacts to news from a single economy and government, and sterling is more sensitive to shifts in risk mood. The gap varies over time, so check recent ranges on your own charts.
What moves GBP/USD the most?
Over time, the balance between Bank of England and Federal Reserve policy, and expectations for it, matters most. Day to day, the largest moves usually come from surprises in UK inflation and wage data, US jobs and inflation data, central bank decisions and votes, shifts in risk mood and major political or fiscal events.
Is GBP/USD good for beginners?
It can be, as long as you respect its volatility. It is a liquid major with a fixed $10 pip value per standard lot and generally tight spreads. But its wider swings mean you need wider stops and smaller positions than on EUR/USD, and a demo account is the right place to get used to them.
Free course
Learn this step by step
“Forex Foundations” is a free BrokerCut Academy course: 11 short lessons (about 92 minutes), quizzes, interactive tools and a certificate when you finish.
Enrol free